I was inspired to write this field note after I worked my way through a problem with my Claude workflow that converts .svg sketches into branded, high-fidelity svg diagrams. But when I attempted to run this on a more complex diagram, this happened:
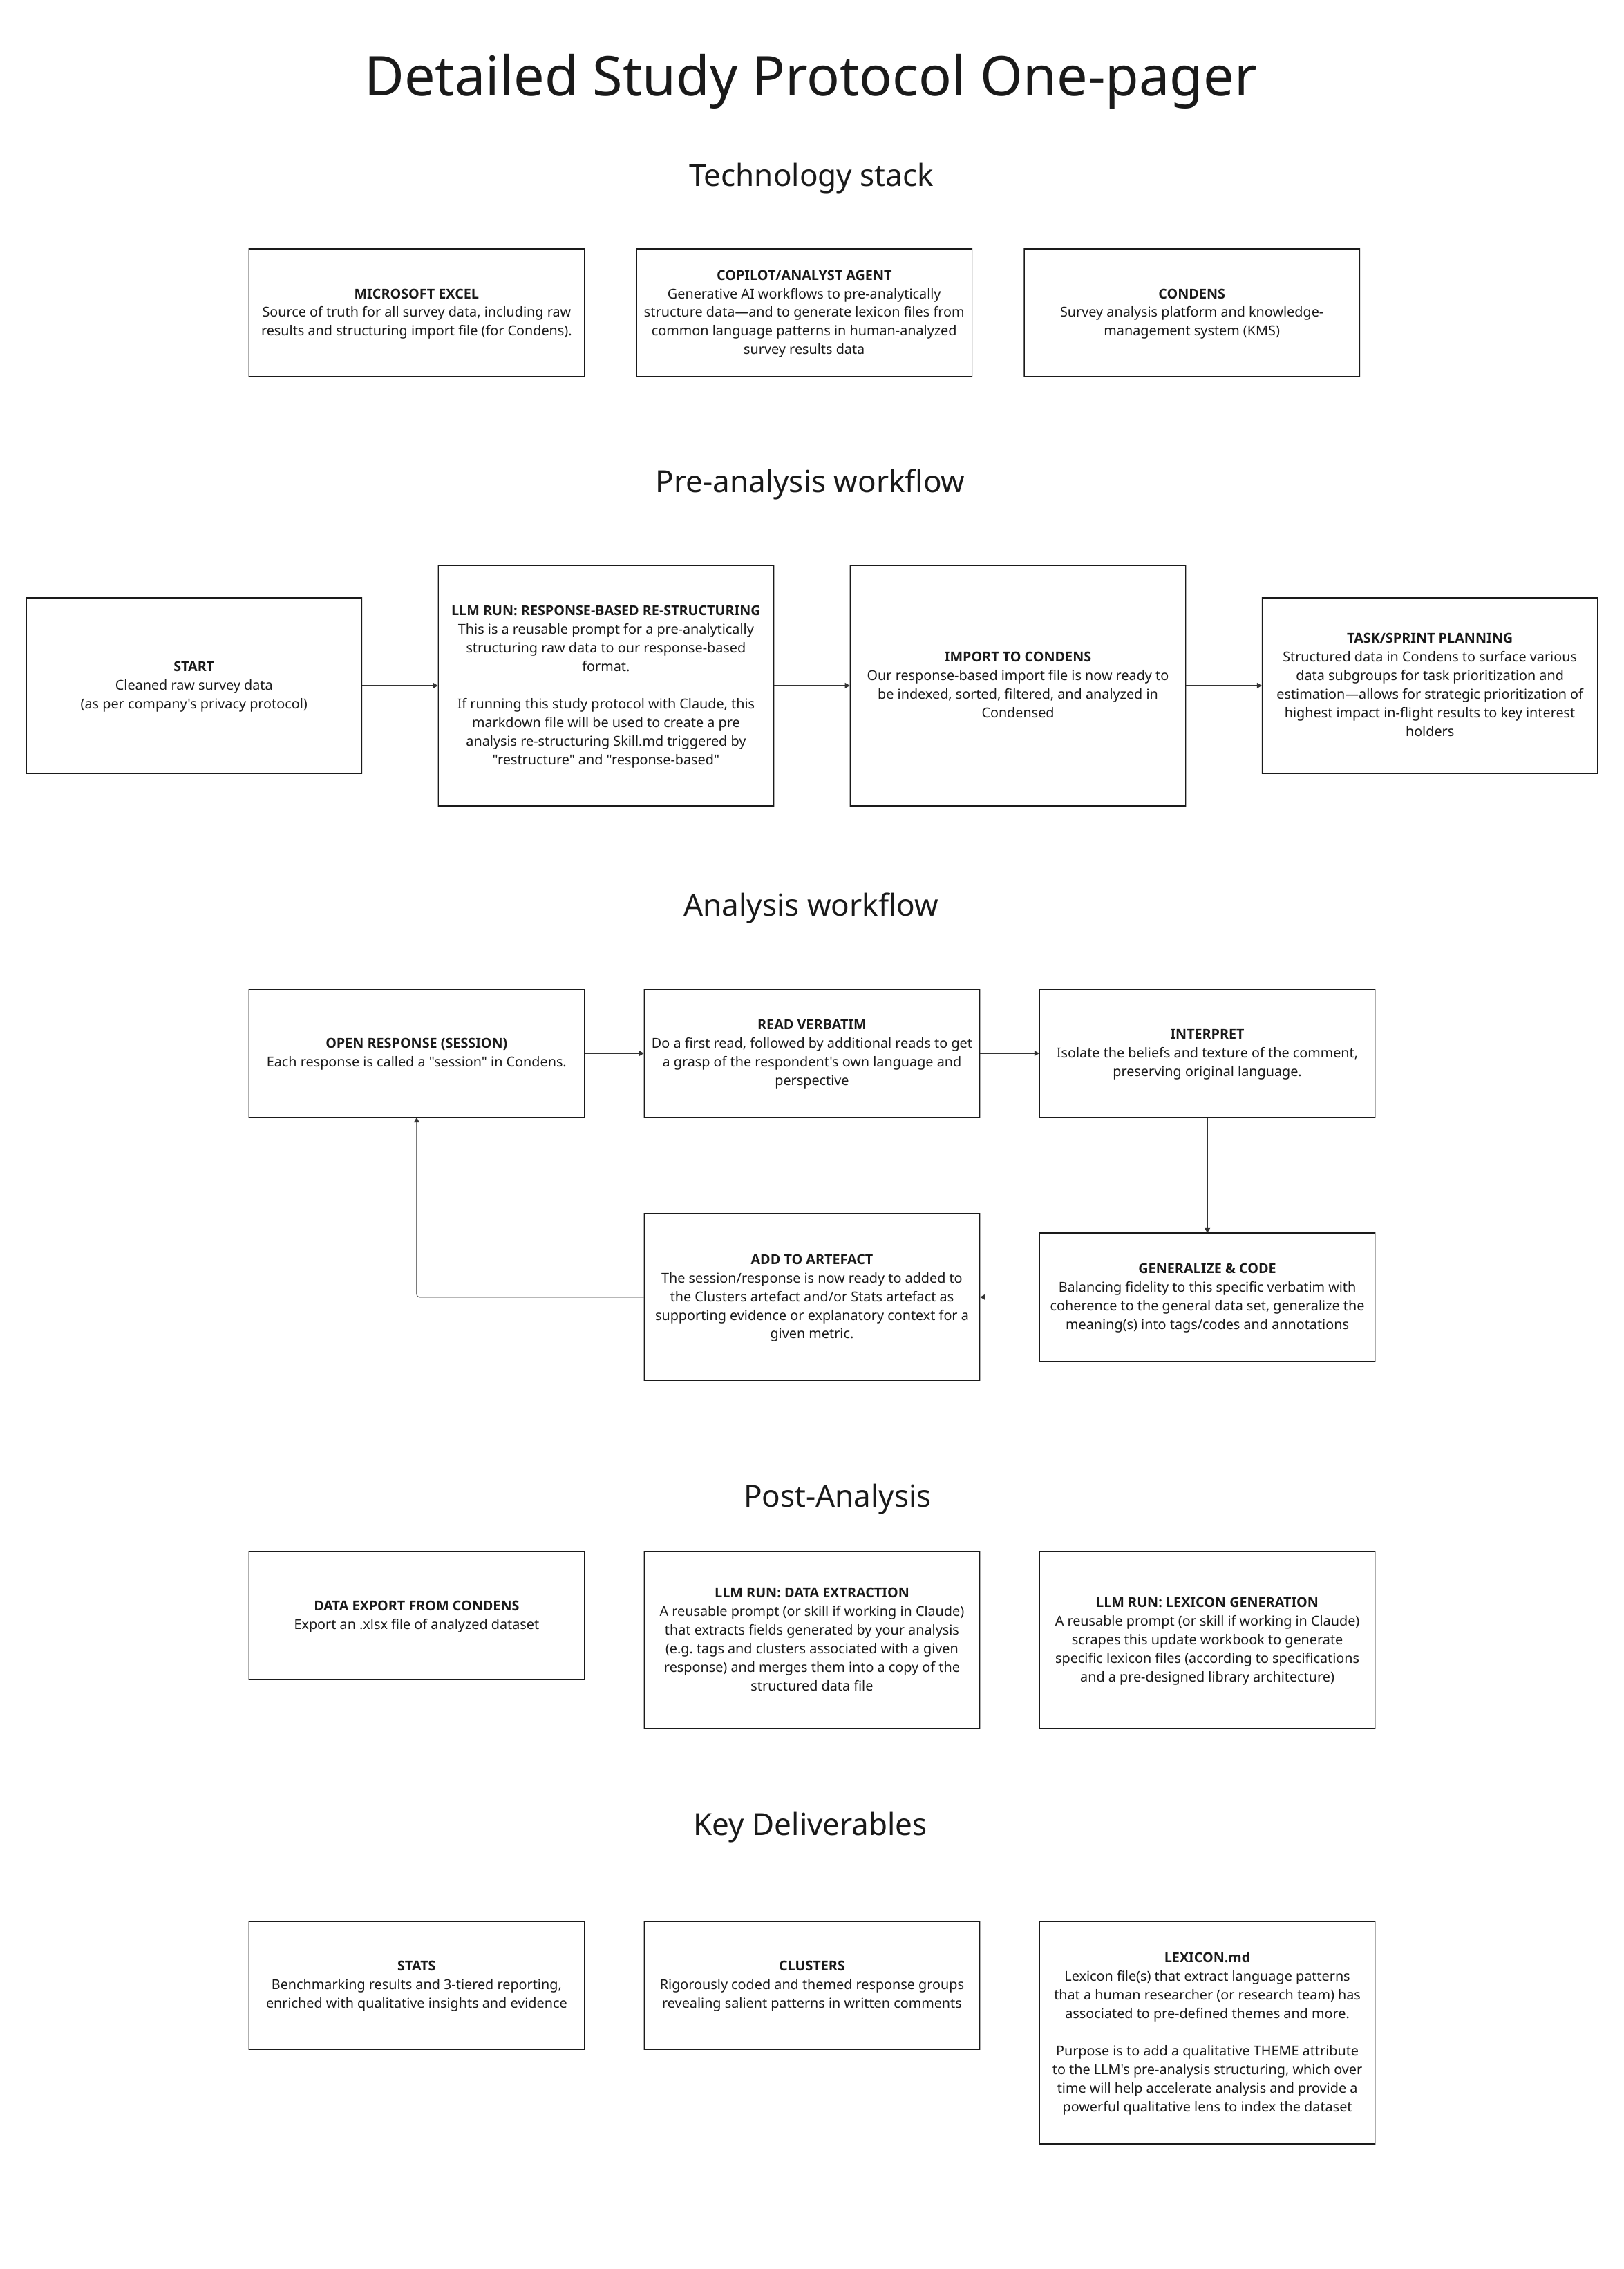
My original input:
Claude's misinterpration and failed output:
The Problem
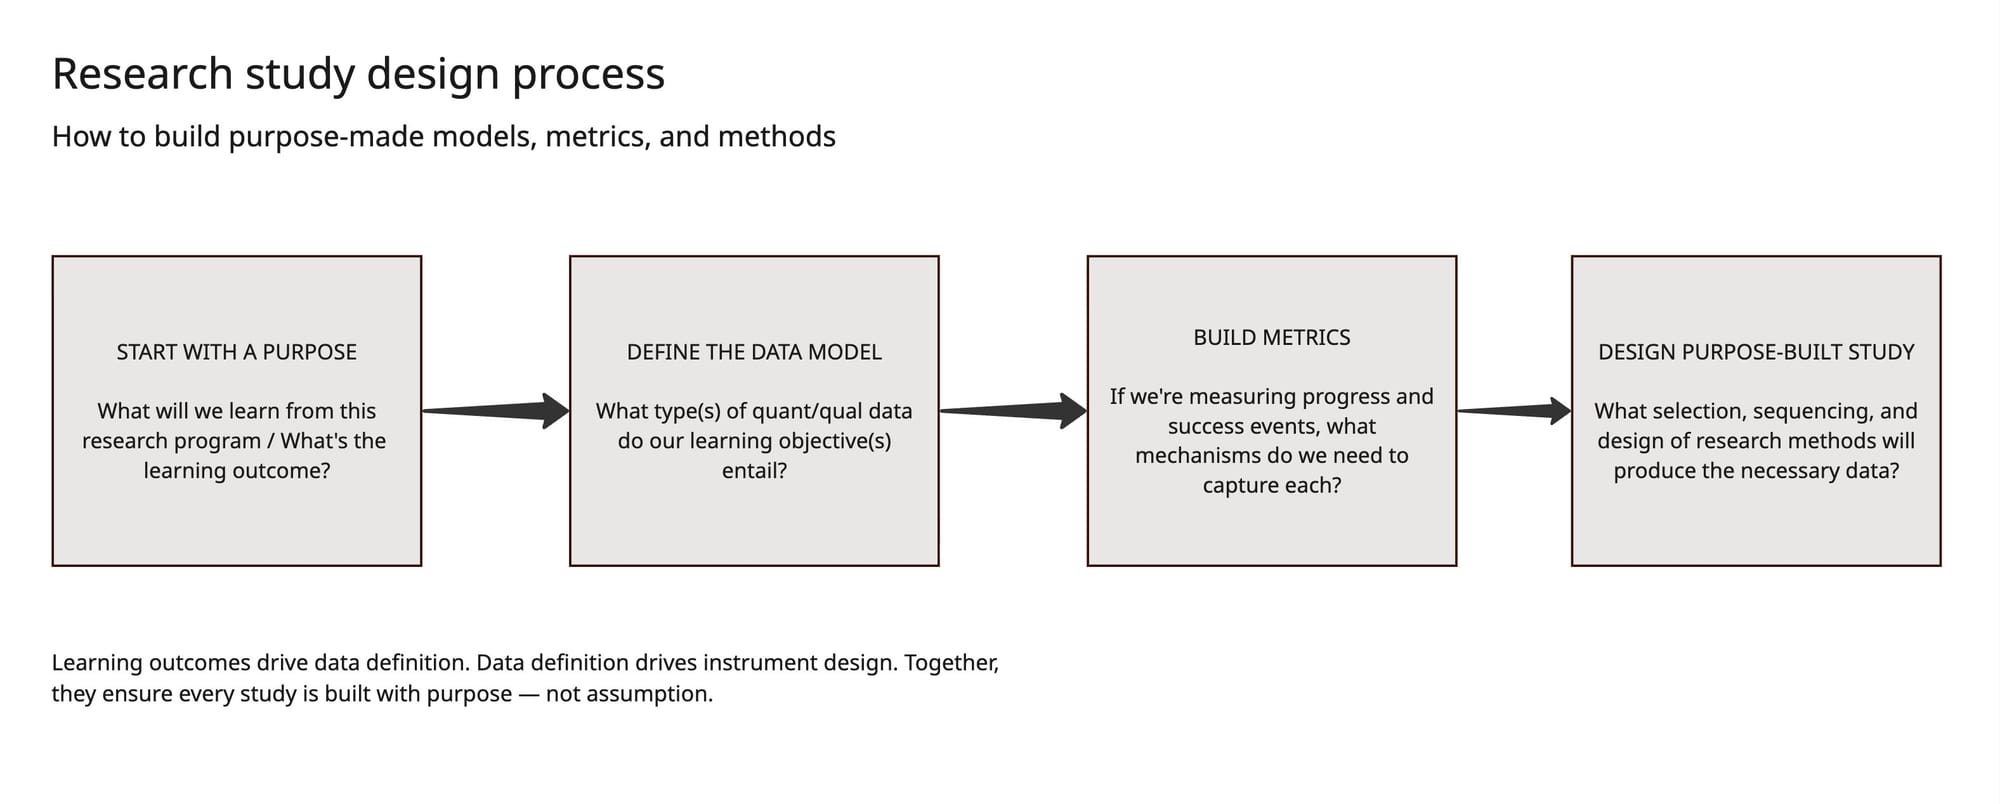
While there was no difficulty for the workflow to reliably convert a simple sketch like this:
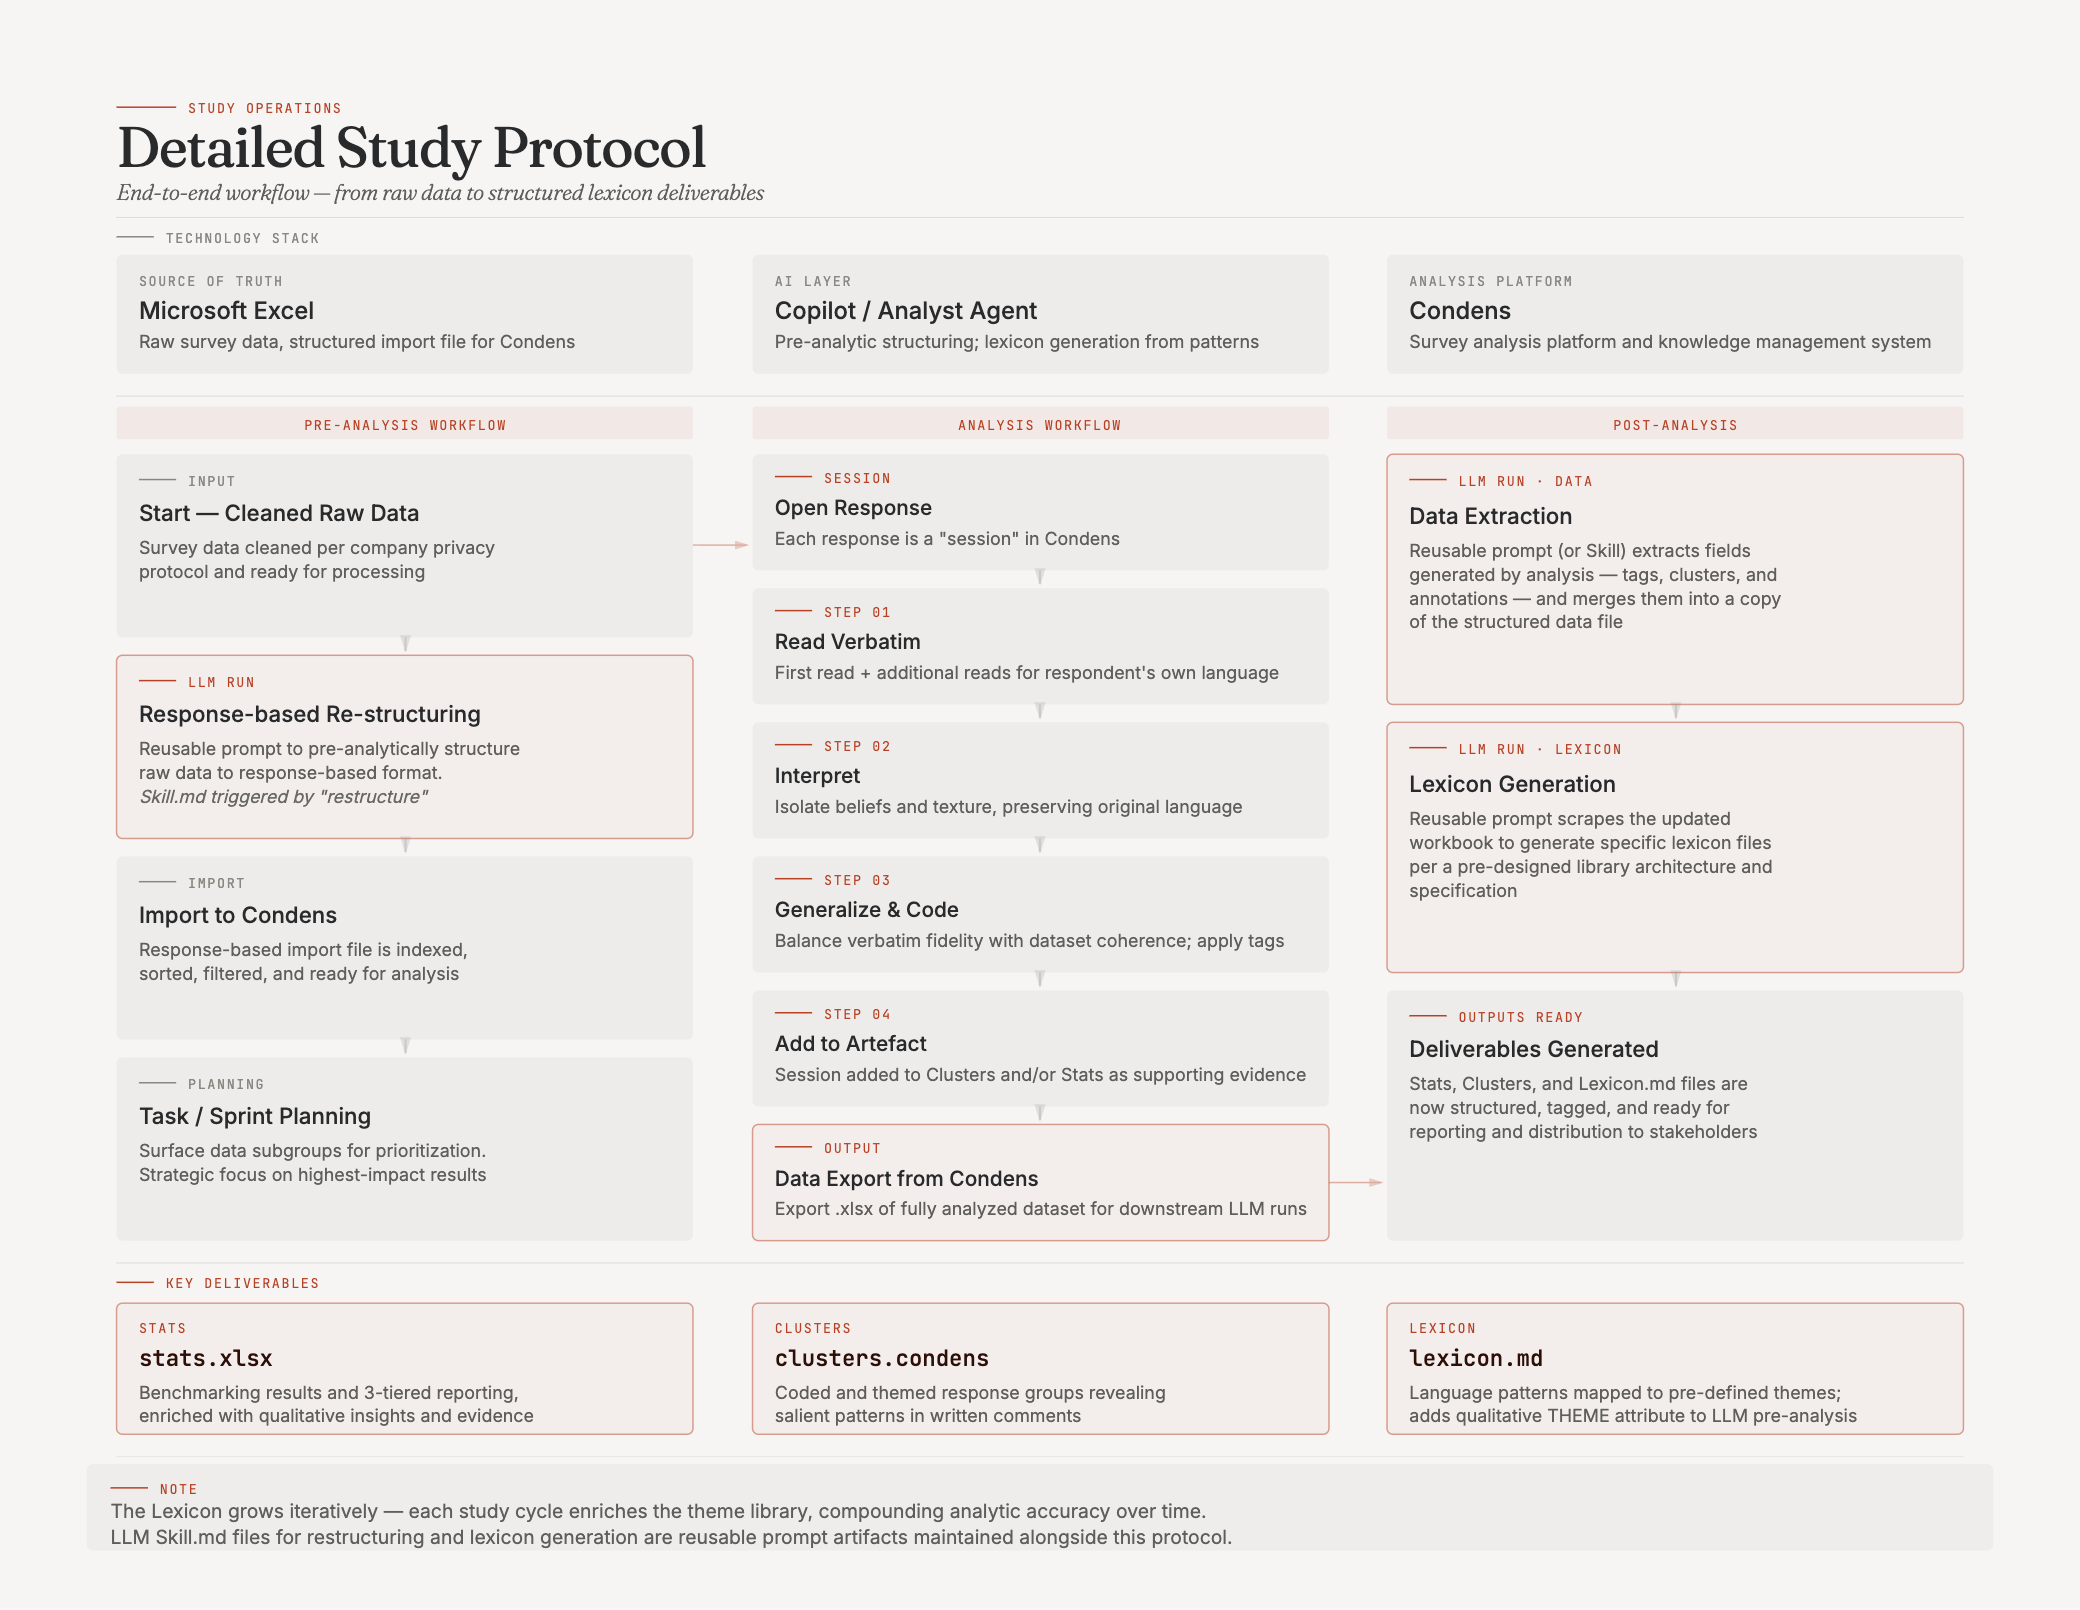
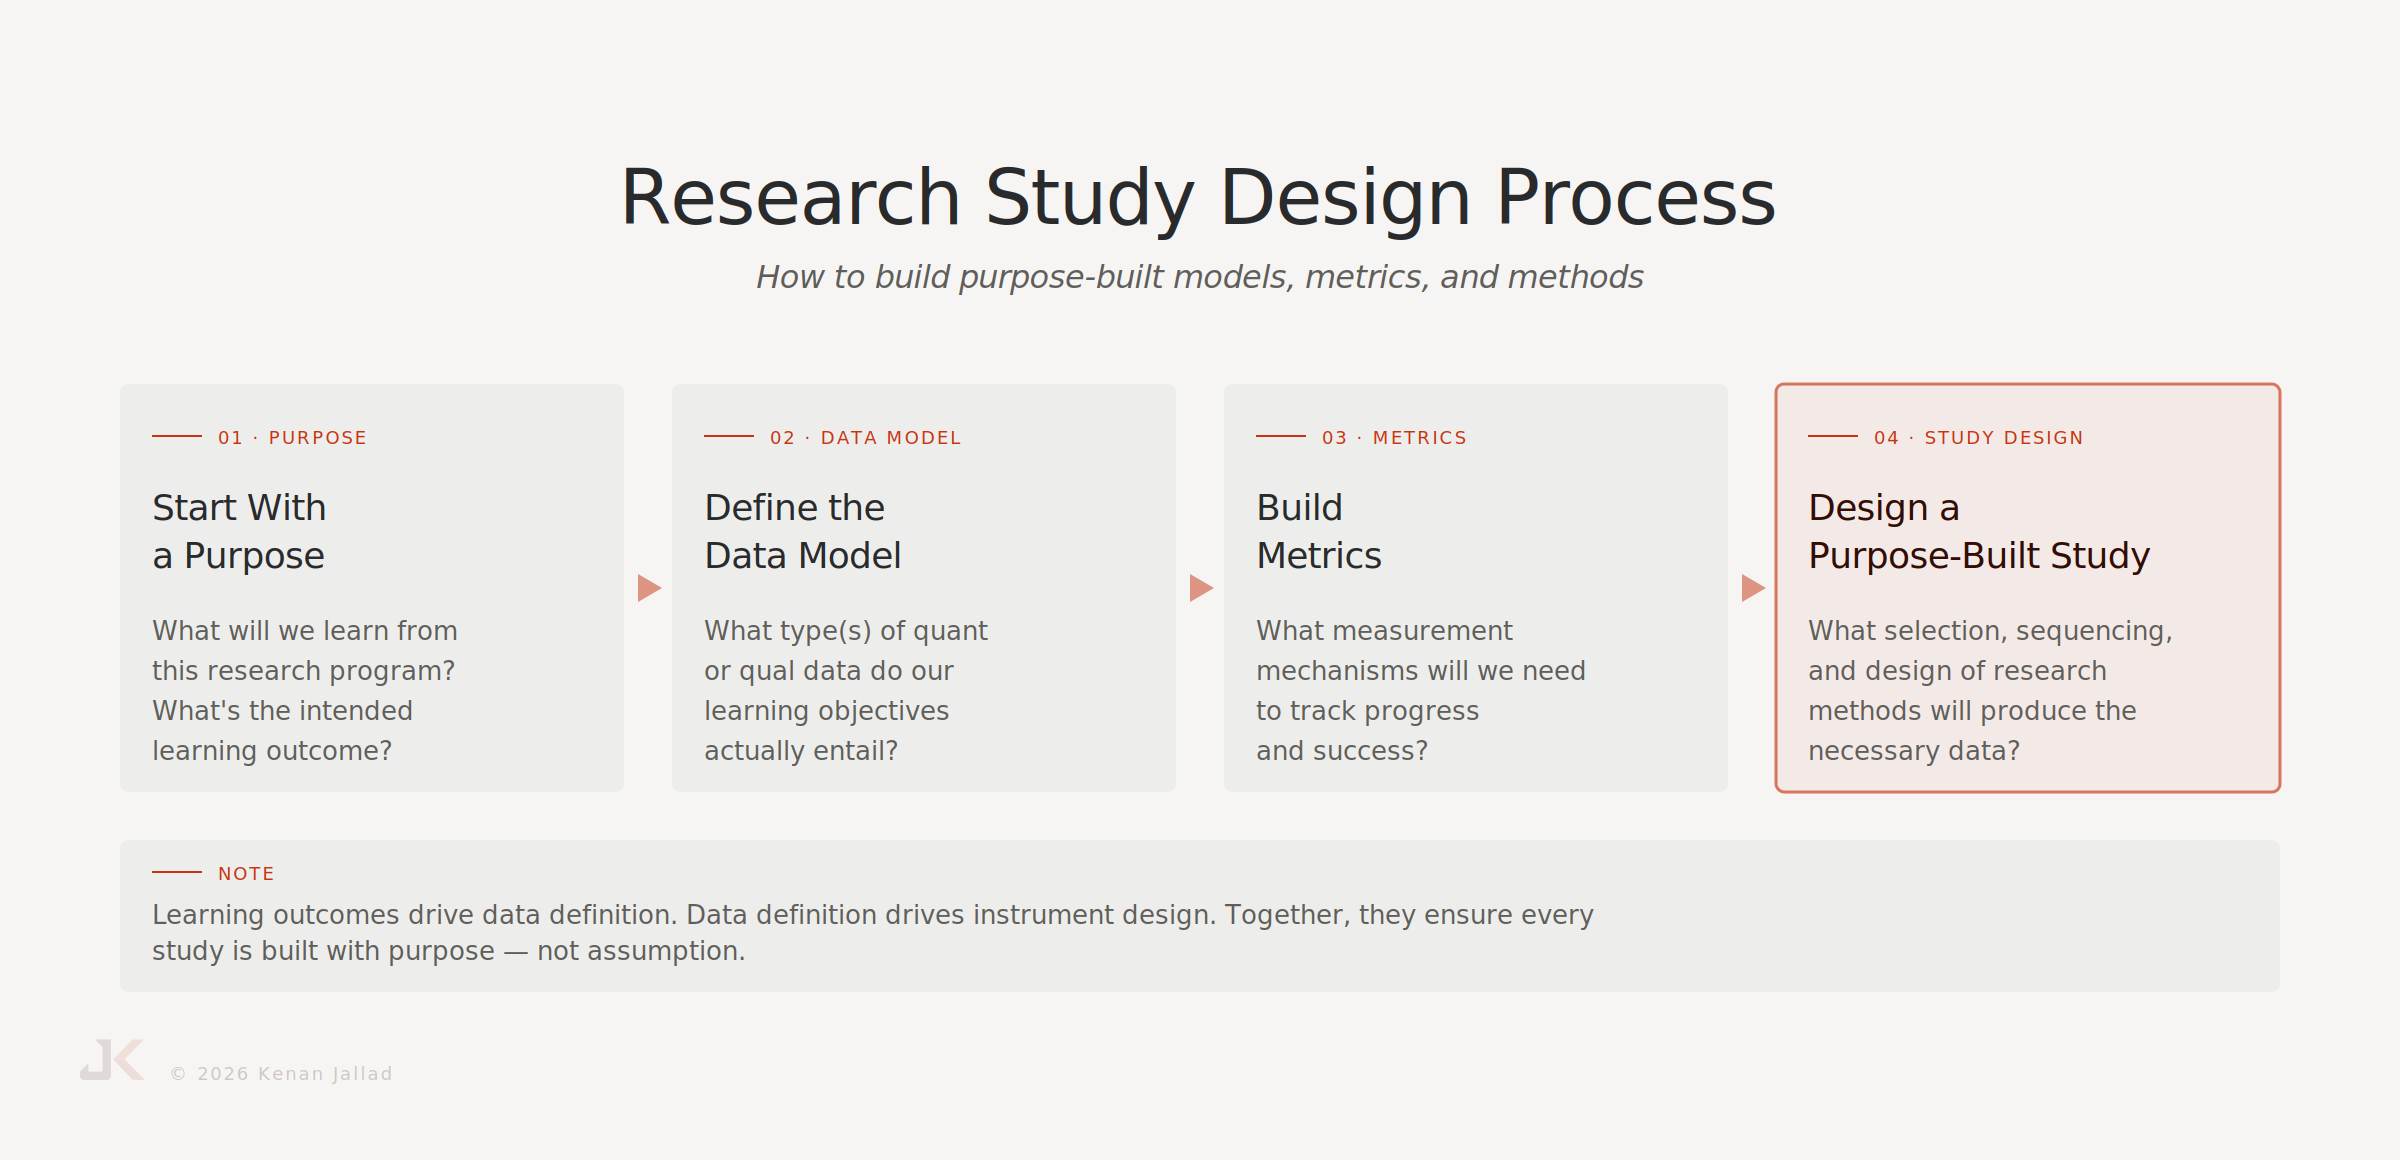
Into this branded diagram:
Claude seemed to get thrown for a loop when receiving these two (self-contained) flow diagrams, misinterpreting the entire artefact as one cohesive flow — and proceeded to invent many connections not originally specified in my input file to make it all make sense — (I secretly love when unexpected results like this happen; it's a way to get to know how a generative AI model really "thinks").
The solution
For simple use-cases, only 2 files are put into a fresh chat session:
- Design spec: style-guide.md — which I based off my site's styles.css file
- Model image: diagram-name.svg — which I export from Miro (unavailable without a paid license)
In complex use-cases, a 3rd file is added for written specifications that illustrate a text-based visual map for Claude, overriding any impulse Claude has to attempt its own interpretation:
- Text spec: diagram-name-instructions.md
My intention for this text spec was to tell Claude what it sees and what it will interpret. I described the artefact top to bottom, section by section, and in either a left-to-right or right-to-left orientation — kinda like how ARIA attributes help assistive technologies understand webpages and navigate content.
I dropped in my 3 files and a minute later I received the successful rendering of the branded diagram, above.
Claude generated 100% intended results the first try with 2 other complex diagrams — including a non-linear model image (a flywheel). The addition of text specs to a model image and design spec will ensure the artefact gets rendered exactly as intended the first time.
Try it yourself
Here are the steps and resources needed to do this yourself. Let's cover a simple (section 1) example, followed by a complex (section 3) one.
Simple example (section 1)
Model image (.svg)
Text spec (.md or .txt)
You can either write it in markdown like this:
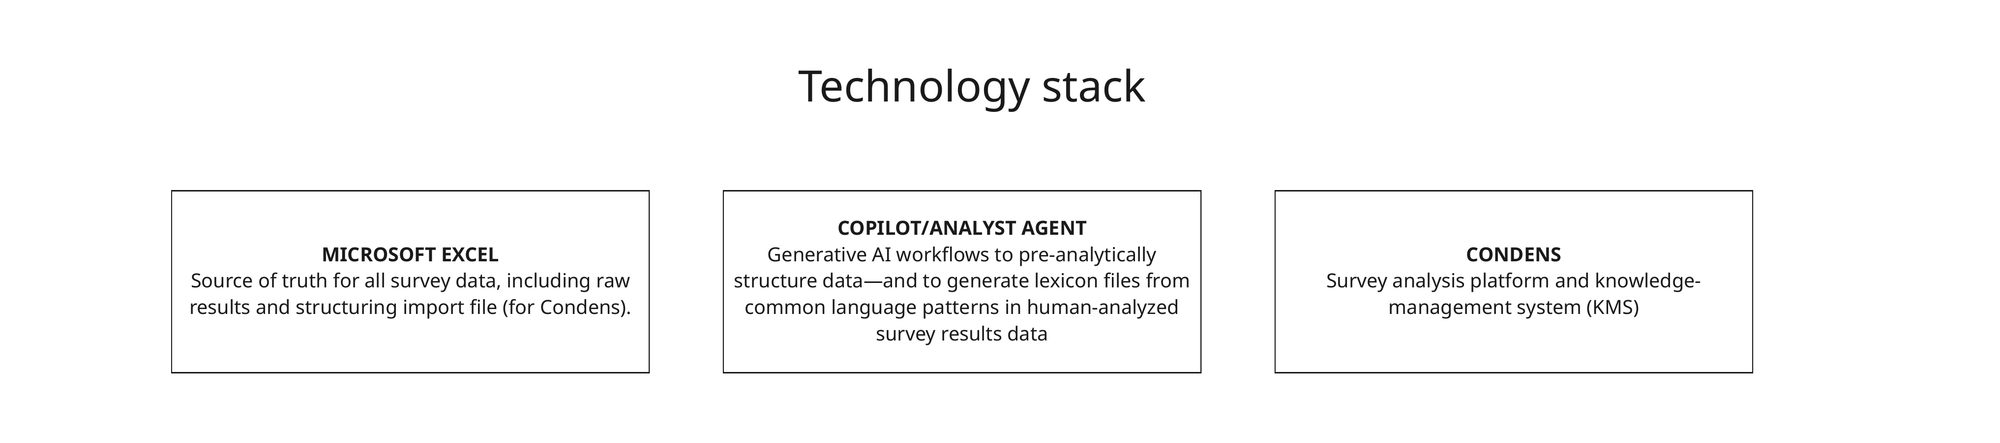
## SECTION 1: Technology Stack

Microsoft Excel | Copilot/Analyst Agent | Condens

---
Learning basic markdown is an asset when working with Claude or other LLMs for its structural clarity, specificity, and many other benefits — but it's not necessary for this workflow
Or write it in plain language with clear logic:
SECTION 1: "Technology Stack"

INSTRUCTION: There are 3 horizontally arranged cards in left-to-right order: Microsoft Excel, Copilot/Analyst Agent, Condens — no arrows or step indicators connecting them.
Written in plain language with clear logic — use a plain text editor (.txt)
Complex example (section 3)
Model image (.svg)
Text spec (.md or .txt)
Markdown:
---
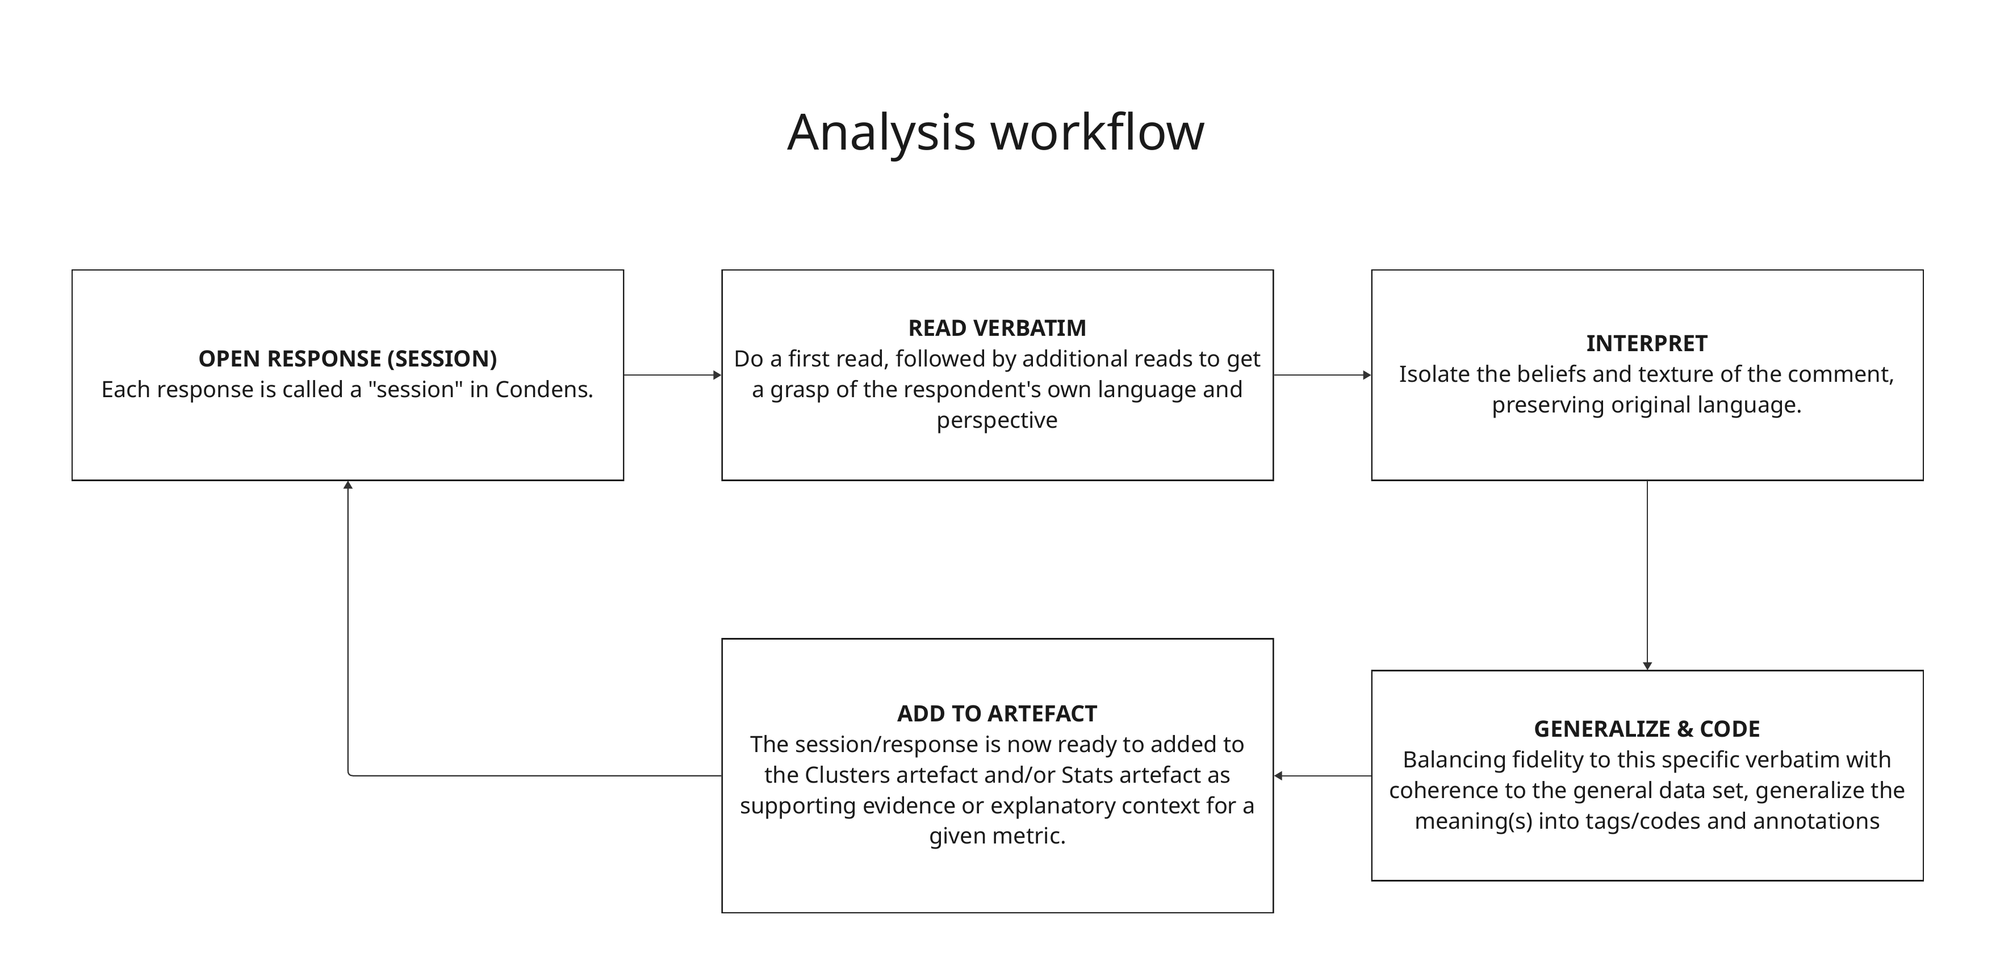
## SECTION 3: Analysis Workflow
**Row 1 (Left to Right):**
Open response (session) → Read Verbatim → Interpret
**Row 2 (Right to Left):**
Generalize & Code ← Add to Artefact
**Connections:**
- Interpret (Row 1) ↓ Generalize & Code (Row 2)
- Generalize & Code → Add to Artefact
- Add to Artefact ↻ Open response (session) [cycles back]
---I find the logic expressed in this markdown to be illuminating and elegant (compare with the plain text version I wrote)
Plain language, clear logic:
SECTION 3: Analysis Workflow
INSTRUCTION: This is a process diagram that runs across two horizontally-arranged rows left-to-right. The first row has 3 cards: Open response (session), Read Verbatim, Interpret. The arrows connect the boxes pointing to the right. The second row has 2 cards that flow in the opposite direction, from right-to-left: Generalize & Code, Add to Artefact. An arrow pointing from the middle-bottom of the 3rd box in the first row (with the Interpret heading) connects to the middle-top of the right-most box in the second row (“Generalize & Code”). An arrow, pointing to the left connects with the right side of the “Add to Artefact” box. The “Add to Artefact” box has an arrow that connects from the left side of its box pointing to the middle-bottom of the “Open Response(session)” box.
Writing in plain text with common sense logic is verbose but nets the same result. Don't let learning markdown be a barrier.
Successful output

Full skill template
Below is the full script for this skill. I generalized it so it can serve as a scaffolding for whatever values you end up defining in your own brand and creative style guidelines:
I uploaded this svg.skill script to a GitHub Gist for anyone who wants to try this out.
Bonus info!
For people who prefer pen and paper
Use the "complex" version of this workflow to accurately describe and render napkin and white board sketches — or anything hand-drawn into polished assets!
Repetitive tasks → claude.skill
Given this workflow is for case study assets, it's going to be a highly repetitive task.
✅ Key takeaway: whenever you have a repetitive task, this is a signal to define this task into a "skill" (learn more at: support.claude.com).
To do this, I built from a successful pilot session where Claude got the task right. I closed that session by downloading my successfully created branded asset and prompting Claude to generate a skill out of this task. You'll see a call to action to "save skill", click that and now this is available to use for all future sessions.
Styles.css → style-guide.md
I mentioned I already had an established style guide and design system for my portfolio site. Claude was initially given a styles.css file from https://kenanjallad.com/, along with the .svg diagram sketch.
You can use this svg-style-guide script I generalized as a scaffolding:
Download the .svg diagram style guide template to build your own out.
A quality style guide should produce a first output that's within acceptable limits. Once an output is deemed ready to lock in, this is when you prompt for the final deliverable along with the style-guide.md (and the .skill file).
This closing step is critical for codifying successful workflows, locking in important decisions and specs, maintaining context across chats, and avoiding time and cost-intensive rework.